时间:2023-08-04 23:11:26 点击次数:7
自学python的数据分析,爬虫后,花了几天时间看视频学习Flask做了一个简单的股票查询网页。本来还想着加入一些其他功能,比如财务指标分析,舆情分析,最完美的想法是做成一个股票评分系统,输入股票代码可以自动输出分析结果和最终评分以及排名。但是限于没有服务器(不想花钱买)于是先到此为止,后面计划先实现股票评分的本地系统化,然后有机会再部署到网站上。有类似想法的欢迎交流~
先放一张最终效果图。网页左上角输入股票代码,可以在下方显示实时行情、历史走势、股评词云等信息。这是本菜鸡第一次开发网页,所以是非常简单的版本。后面想要继续实现本地化的打分系统,因为虽然同花顺等炒股软件包含智能筛选功能,但是缺少一些个性化的分析指标,不知道我的这个想法是否可行?有没有价值去做?求建议!
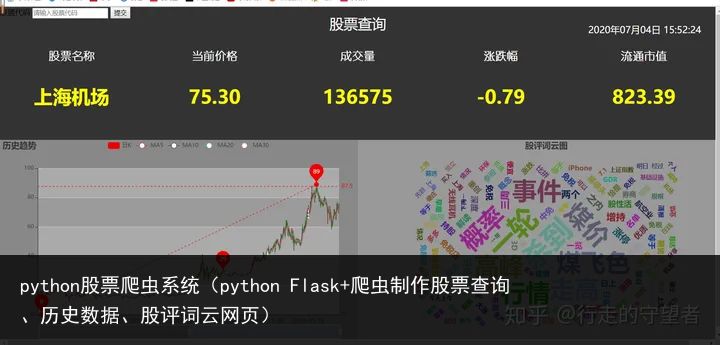
前端页面输入股票代码传到后端,即可从网易财经、腾讯财经提供的数据接口api爬取相关股票的数据,然后利用ajax和exharts呈现到网页上。右下方的词云图是从东方财富爬取的股评信息后制作的。
具体实现过程一共花了不到一周时间,下面是全部文档信息。主要文件有四个,app.py为flask写的后端,main.html和main.css写前端,utils.py写了一些爬虫和数据处理的函数。
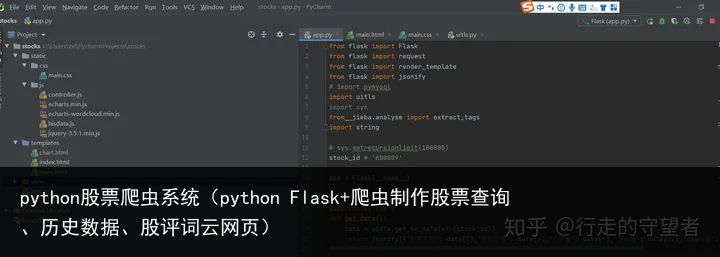
下面分别贴出4个文档的代码,可能包括一些冗余信息(连接mysql的一些操作,之前想做财务指标呈现是用到的)。
flask写的后端,模式比较固定,难点在于前后台数据的交互(用到ajax)。
from flask import Flask from flask import request from flask import render_template from flask import jsonify # import pymysql import uitls import sys from jieba.analyse import extract_tags import string # sys.setrecursionlimit(100000) stock_id = 600009 app = Flask(__name__) @app.route("/be") def get_data(): data = uitls.get_be_data(str(stock_id)) return jsonify({"股票名称": data[1],"当前价格": data[3],"成交量": data[6],"涨跌幅": data[32],"流通市值": data[44]}) @app.route("/his", methods=["get", "post"]) def get_history_data(): msg = uitls.get_history_data(str(stock_id)) print(msg) print(type(msg)) return jsonify({"日期":msg[日期],"开盘价":msg[开盘价],"收盘价":msg[收盘价],"最低价":msg[最低价],"最高价":msg[最高价]}) # jsonify({"日期": msg[日期][0],"开盘价":msg[开盘价][0]}) @app.route("/gp", methods=["get", "post"]) def get_guping(): data = uitls.get_guping(stock_id) d = [] for i in data: k = i.rstrip(string.digits) v = i[len(k):] ks = extract_tags(k) # print(v) for j in ks: if not j.isdigit(): d.append({name: j, value: v}) return jsonify({kws:d}) @app.route("/time", methods=["get", "post"]) def get_time(): return uitls.get_time() @app.route("/", methods=["get", "post"]) def input_id(): return render_template("main.html") @app.route("/ind", methods=["get", "post"]) def get_id(): global stock_id stock_id = request.values.get("股票代码") print(stock_id) return render_template("main.html") if __name__ == __main__: app.run()2.main.html
这里包含了echarts中的K线图和词云图模板,所以看起来比较长。
<!DOCTYPE html> <html> <head link rel="shortcut icon" href="#" /> <meta charset="utf-8"> <title>股票数据</title> <script src="../static/js/jquery-3.5.1.min.js"></script> <script src="../static/js/echarts.min.js"></script> <script src="../static/js/echarts-wordcloud.min.js"></script> <link href = "../static/css/main.css" rel = "stylesheet"/> </head> <body> <div id = "title">股票查询</div> <form action="/ind"> 股票代码 <input name = "股票代码" placeholder="请输入股票代码"> <button>提交</button> </form> <div id = "tim">我是时间</div> <div id = "be"> <div class ="tex"><h2>股票名称</h2></div> <div class ="tex"><h2>当前价格</h2></div> <div class ="tex"><h2>成交量</h2></div> <div class ="tex"><h2>涨跌幅</h2></div> <div class ="tex"><h2>流通市值</h2></div> <div class ="num"><h1>123</h1></div> <div class ="num"><h1>123</h1></div> <div class ="num"><h1>123</h1></div> <div class ="num"><h1>123</h1></div> <div class ="num"><h1>123</h1></div> </div> <div id="bl" style="width: 800px;height:435px;">我是瞎做</div> <script> var hisdata = echarts.init(document.getElementById(bl)); var upColor = #ec0000; var upBorderColor = #8A0000; var downColor = #00da3c; var downBorderColor = #008F28; hisdata_option = { title: { text: 历史趋势, left: 0 }, tooltip: { trigger: axis, axisPointer: { type: cross } }, legend: { data: [日K, MA5, MA10, MA20, MA30] }, grid: { left: 10%, right: 10%, bottom: 15% }, xAxis: { type: category, data: [], scale: true, boundaryGap: false, axisLine: {onZero: false}, splitLine: {show: false}, splitNumber: 20, min: dataMin, max: dataMax }, yAxis: { scale: true, splitArea: { show: true } }, dataZoom: [ { type: inside, start: 50, end: 100 }, { show: true, type: slider, top: 90%, start: 50, end: 100 } ], series: [ { name: 日K, type: candlestick, data: [], itemStyle: { color: upColor, color0: downColor, borderColor: upBorderColor, borderColor0: downBorderColor }, markPoint: { label: { normal: { formatter: function (param) { return param != null ? Math.round(param.value) : ; } } }, data: [ { name: XX标点, coord: [2013/5/31, 2300], value: 2300, itemStyle: { color: rgb(41,60,85) } }, { name: highest value, type: max, valueDim: highest }, { name: lowest value, type: min, valueDim: lowest }, { name: average value on close, type: average, valueDim: close } ], tooltip: { formatter: function (param) { return param.name + <br> + (param.data.coord || ); } } }, markLine: { symbol: [none, none], data: [ [ { name: from lowest to highest, type: min, valueDim: lowest, symbol: circle, symbolSize: 10, label: { show: false }, emphasis: { label: { show: false } } }, { type: max, valueDim: highest, symbol: circle, symbolSize: 10, label: { show: false }, emphasis: { label: { show: false } } } ], { name: min line on close, type: min, valueDim: close }, { name: max line on close, type: max, valueDim: close } ] } }, { name: MA5, type: line, data: , smooth: true, lineStyle: { opacity: 0.5 } }, { name: MA10, type: line, data: , smooth: true, lineStyle: { opacity: 0.5 } }, { name: MA20, type: line, data: , smooth: true, lineStyle: { opacity: 0.5 } }, { name: MA30, type: line, data: , smooth: true, lineStyle: { opacity: 0.5 } }, ] }; </script> <div id="br" style="width: 800px;height:435px;">我是下游</div> <script> var gp = echarts.init(document.getElementById(br)); var ddd = [{ name: Farrah Abraham, value: 366, // Style of single text }]; var maskResource = new Image() maskResource.src=image1; gp_option = { title:{ text: 股评词云图, left:center, }, //数据可以点击 tooltip:{ show:false }, series: [{ type: wordCloud, // The shape of the "cloud" to draw. Can be any polar equation represented as a // callback function, or a keyword present. Available presents are circle (default), // cardioid (apple or heart shape curve, the most known polar equation), diamond ( // alias of square), triangle-forward, triangle, (alias of triangle-upright, pentagon, and star. shape: circle, // A silhouette image which the white area will be excluded from drawing texts. // The shape option will continue to apply as the shape of the cloud to grow. // maskImage: maskResource, // // Folllowing left/top/width/height/right/bottom are used for positioning the word cloud // // Default to be put in the center and has 75% x 80% size. left: center, top: center, width: 70%, height: 80%, right: null, bottom: null, // Text size range which the value in data will be mapped to. // Default to have minimum 12px and maximum 60px size. sizeRange: [12, 60], // Text rotation range and step in degree. Text will be rotated randomly in range [-90, 90] by rotationStep 45 rotationRange: [-90, 90], rotationStep: 45, // size of the grid in pixels for marking the availability of the canvas // the larger the grid size, the bigger the gap between words. gridSize: 8, // set to true to allow word being draw partly outside of the canvas. // Allow word bigger than the size of the canvas to be drawn drawOutOfBound: false, // Global text style textStyle: { normal: { fontFamily: sans-serif, fontWeight: bold, // Color can be a callback function or a color string color: function () { // Random color return rgb( + [ Math.round(Math.random() * 160), Math.round(Math.random() * 160), Math.round(Math.random() * 160) ].join(,) + ); } }, emphasis: { shadowBlur: 10, shadowColor: #333 } }, // Data is an array. Each array item must have name and value property. data: [{ name: Farrah Abraham, value: 366, // Style of single text }] }] } </script> <script > function getatime(){ $.ajax({ url:"/time", success:function(d){ $("#tim").html(d) }, error:function(jqXHR, textStatus, errorThrown){ console.log(jqXHR.responseText); } }) } function get_be_data(){ $.ajax({ url:"/be", success:function(data){ $(".num h1").eq(0).text(data[股票名称]) $(".num h1").eq(1).text(data[当前价格]) $(".num h1").eq(2).text(data[成交量]) $(".num h1").eq(3).text(data[涨跌幅]) $(".num h1").eq(4).text(data[流通市值]) }, error:function(jqXHR, textStatus, errorThrown){ console.log(jqXHR.responseText); } }) } function get_guping(){ $.ajax({ url:"/gp", success:function(data){ gp_option.series[0].data = data.kws; gp.setOption(gp_option); }, error:function(jqXHR, textStatus, errorThrown){ console.log(jqXHR.responseText); } }) } function get_his_data(){ $.ajax({ url:"/his", success:function(msg){ var datalen = msg[日期].length k_time =[] k_value = [] for (var i = 0; i < datalen; i++) { k_time.push(msg[日期][i]); k_value.push([msg[开盘价][i], msg[收盘价][i], msg[最低价][i], msg[最高价][i]]) } console.log(k_time) console.log(k_value) function calculateMA(dayCount) { var result = []; for (var i = 0, len = k_value.length; i < len; i++) { if (i < dayCount) { result.push(-); continue; } var sum = 0; for (var j = 0; j < dayCount; j++) { sum += k_value[i - j][1]; } result.push(sum / dayCount); } return result; } hisdata_option.xAxis.data = k_time; hisdata_option.series[0].data = k_value; hisdata_option.series[1].data = calculateMA(5); hisdata_option.series[2].data = calculateMA(10); hisdata_option.series[3].data = calculateMA(20); hisdata_option.series[4].data = calculateMA(30); hisdata.setOption(hisdata_option); }, error:function(){ console.log("获取失败"); } }) } setInterval(getatime,1000) setInterval(get_be_data,1000) get_his_data() get_guping() </script> </body> </html>3 .main.css
用于网页整体布局。
body{ margin: 0; background: #333; } #title{ position: absolute; width: 40%; height: 10%; top: 0; left: 30%; /* background-color: #666666; */ color: white; font-size: 30px; display: flex; align-items: center; justify-content: center; } #ins{ position: absolute; width: 40%; height: 20%; top: 10%; left: 0; background-color: grey; } #tim{ position: absolute; /* width: 30%; */ height: 10%; top: 5%; right: 2%; color: #FFFFFF; font-size: 20px; /* background-color: green; */ } #be{ position: absolute; width: 100%; height: 30%; top: 10%; left: 0; color: white; /* background-color: #777777; */ } #bl{ position: absolute; width: 50%; height: 60%; top: 40%; left: 0; background-color: #888888; } #br{ position: absolute; width: 50%; height: 60%; top: 40%; left: 50%; background-color: #999999; } .num{ width: 20%; float: left; display: flex; align-items: center; justify-content: center; color:yellow; font-size: 20px; } .tex{ width: 20%; float: left; font-family: "幼圆"; display: flex; align-items: center; justify-content: center;写了一些用于爬取数据和处理数据的函数。
import time import pymysql import urllib.request import pandas as pd import requests import re from bs4 import BeautifulSoup def get_time(): time_str = time.strftime("%Y{}%m{}%d{} %X") return time_str.format("年", "月", "日") def get_conn(): conn = pymysql.connect(host=127.0.0.1, user=root, password=, db=stock, charset=utf8) cursor = conn.cursor() return conn,cursor def close_conn(conn,cursor): cursor.close() conn.close() def query(sql,*args): conn,cursor = get_conn() cursor.execute(sql,args) res = cursor.fetchall() close_conn(conn,cursor) return res # def get_be_data(*args): # sql = "SELECT * FROM hangqing where stockid = %s" # res = query(sql, args) # print(res) # return res[0] def get_be_data(code): url = http://qt.gtimg.cn/q=sh + str(code) content = urllib.request.urlopen(url, timeout=2).read() content = content.decode("gbk").encode("utf-8").decode("utf8", "ignore") content = content.split(~) return content def get_history_data(code): url = http://quotes.money.163.com/service/chddata.html?code=0+str(code) try: content = urllib.request.urlopen(url).read() content = content.decode("gbk").encode("utf-8") with open(E:/hisdata.csv, wb)as f: f.write(content) data = pd.read_csv(E:/hisdata.csv) # data = data.to_dict(record) data = data[["日期","开盘价","收盘价","最低价","最高价"]] # print(data) data = data.to_dict() data[日期] = list(data[日期].values()) data[开盘价] = list(data[开盘价].values()) data[收盘价] = list(data[收盘价].values()) data[最低价] = list(data[最低价].values()) data[最高价] = list(data[最高价].values()) data[日期] = data[日期][::-1] data[开盘价] = data[开盘价][::-1] data[收盘价] = data[收盘价][::-1] data[最低价] = data[最低价][::-1] data[最高价] = data[最高价][::-1] except Exception as e: print(e) return data def get_guping(id): max_page = 2 # input(请输入爬取页数) b = [] # head = {User-Agent: Mozilla/5.0 (Windows NT 10.0; Win64; x64) AppleWebKit/537.36 (KHTML, like Gecko) Chrome/83.0.4103.116 Safari/537.36} for page in range(1, int(max_page) + 1): url = http://guba.eastmoney.com/list,{}_{}.html.format(id, page) res = requests.get(url) soup = BeautifulSoup(res.text, html.parser) urllist = soup.find_all(div, {class: articleh}) for i in urllist: if i.find(a) != None: try: title = i.find(a).get_text() yuedu = i.find(span,{class:l1 a1}).get_text() # time = i.find(span, {class: l5 a5}).get_text() # a = [title + yuedu] b.append(title + yuedu) except Exception as e: print(e) pass return b[7:] if __name__ == __main__: msg = get_guping(600002) print(msg)后面想要继续实现本地化的打分系统,因为虽然同花顺等炒股软件包含智能筛选功能,但是缺少一些个性化的分析指标,不知道我的这个想法是否可行?有没有价值去做?求建议!


